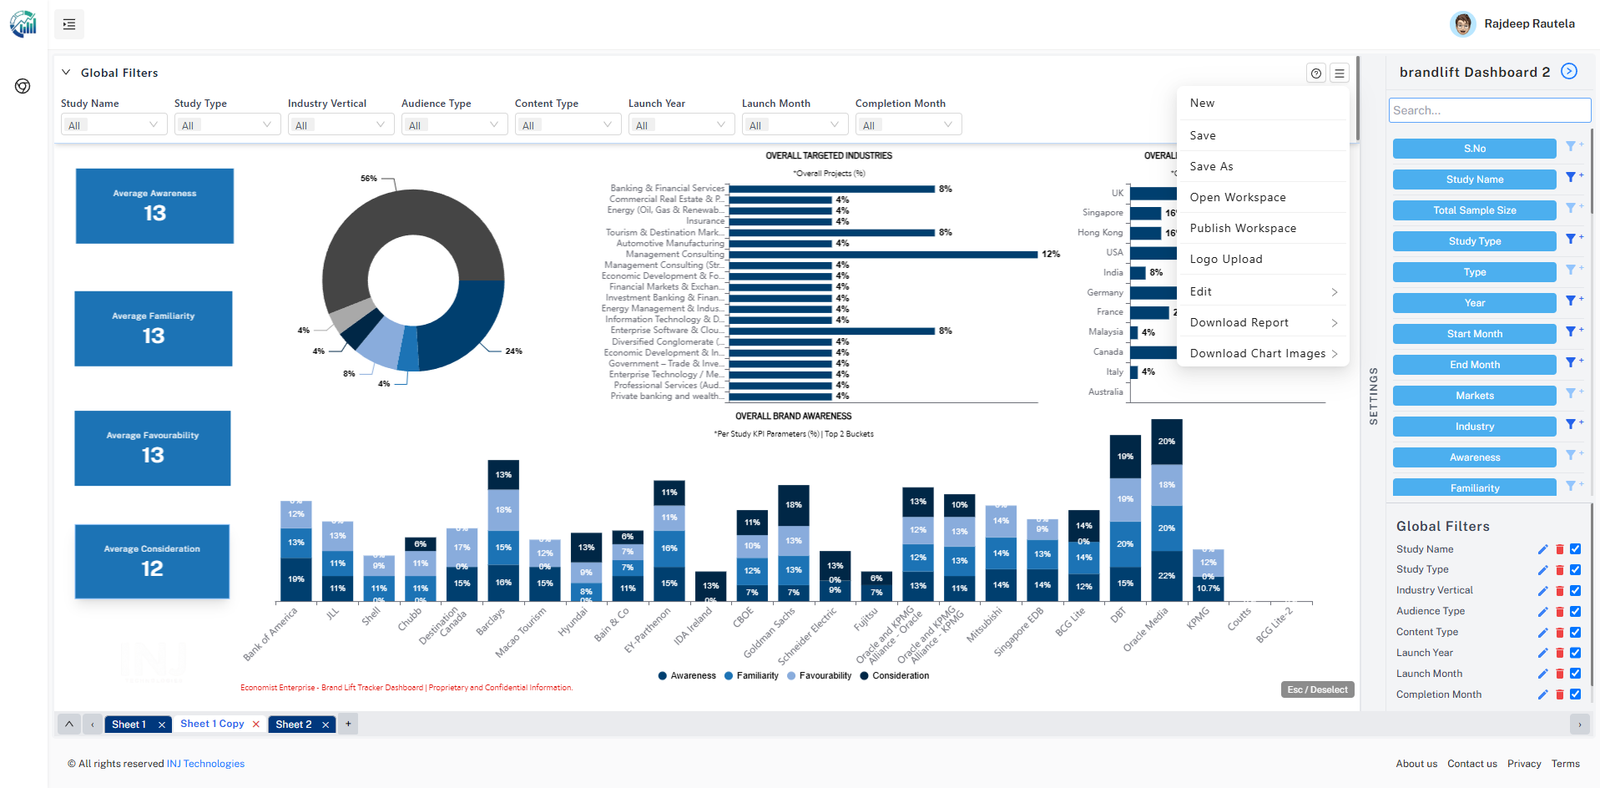
Excel & SPSS upload — columns, labels, and codes are parsed and ready instantly. No reformatting.
Swap in a refreshed data file mid-project and your entire dashboard configuration stays intact.
Load and merge data across multiple uploads for richer, combined analysis.
Every column is detected, typed, and stored as structured data ready for any chart or filter.
Add filters on any column; all charts respond in real time with multi-value selection and rules-based logic.
Use the colour picker for every series, axis, and element, or apply built-in themes like APQC and ECharts classics.
Apply Count, Sum, Average, Min, Max, Count Distinct, Median, or Percentage to any column instantly.
Take control of position, size, labels, tick marks, and grid visibility entirely in-platform.
Build columns, bars, lines, gauges, and KPI cards with full colour control and built-in themes.
Free-position canvas: drag and resize charts, text boxes, images, and logos anywhere.
Add formatted text via the built-in editor and upload brand logos directly onto the canvas.
Generate token-based URLs. Create named, filtered variants with locked or free filters.
Capture your full canvas as a pixel-accurate PDF or a fully formatted PowerPoint (.pptx) file.
Upload a branded .pptx template; Vizual scans it and detects all variable placeholders automatically.
Manage users, roles, and client portal accounts. Internal users only see assigned projects.
Mark projects as New, Running, or Completed and track progress across your full client portfolio.
Let Vizual do the heavy lifting while you focus on the strategy.