Zero setup, 100% browser-based. Log in and start building cross-tabulations instantly. No installs, no IT tickets.
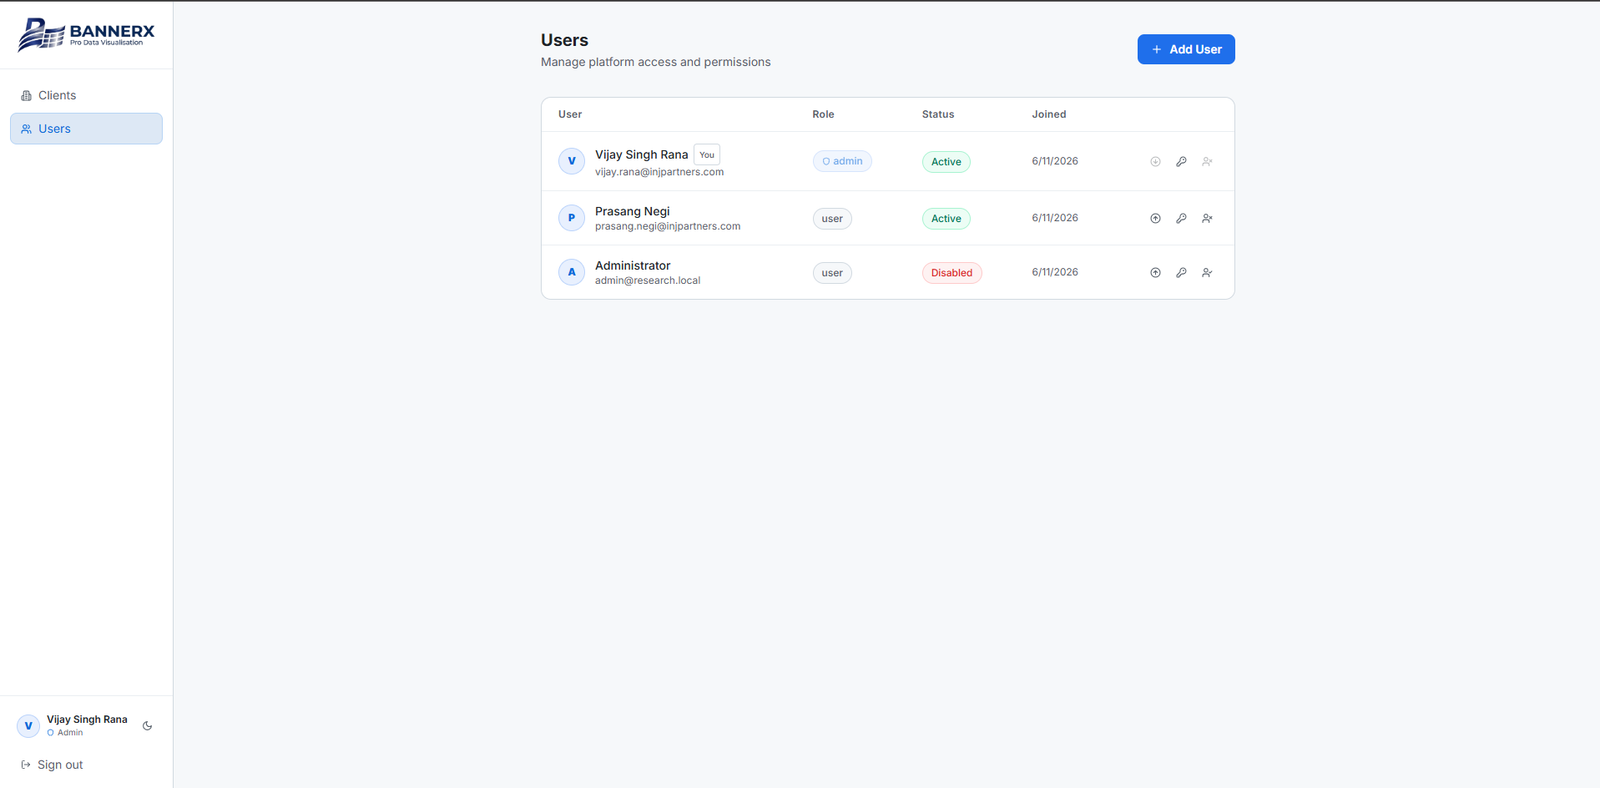
Admins, Analysts, and Clients each get their own tailored experience with the right level of access.
Manage multiple clients and projects in a single workspace, fully siloed from each other.
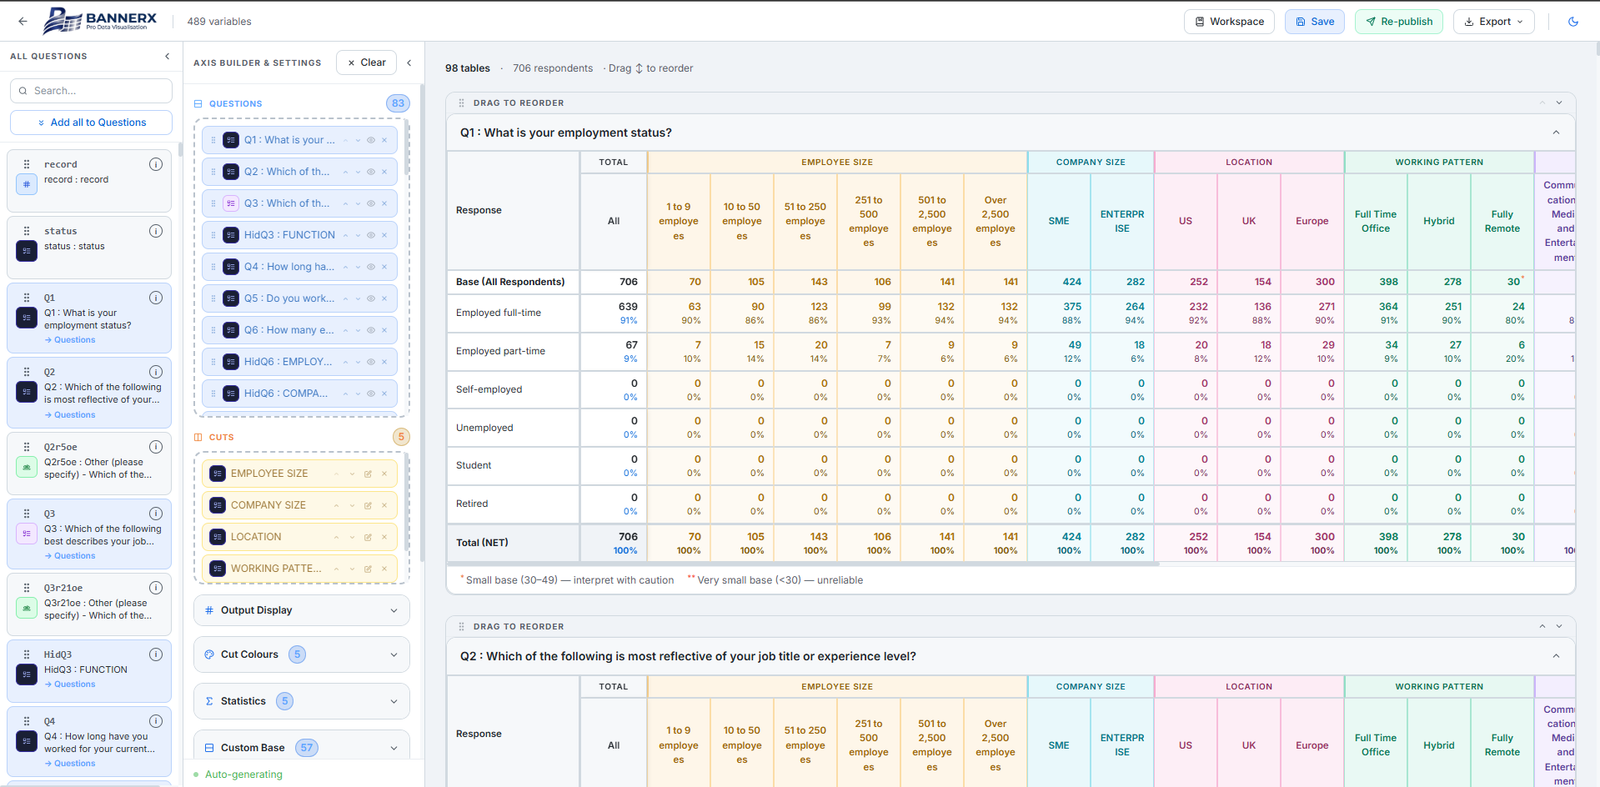
Drop in your .sav file — questions, labels, and codes are read and structured automatically. No reformatting.
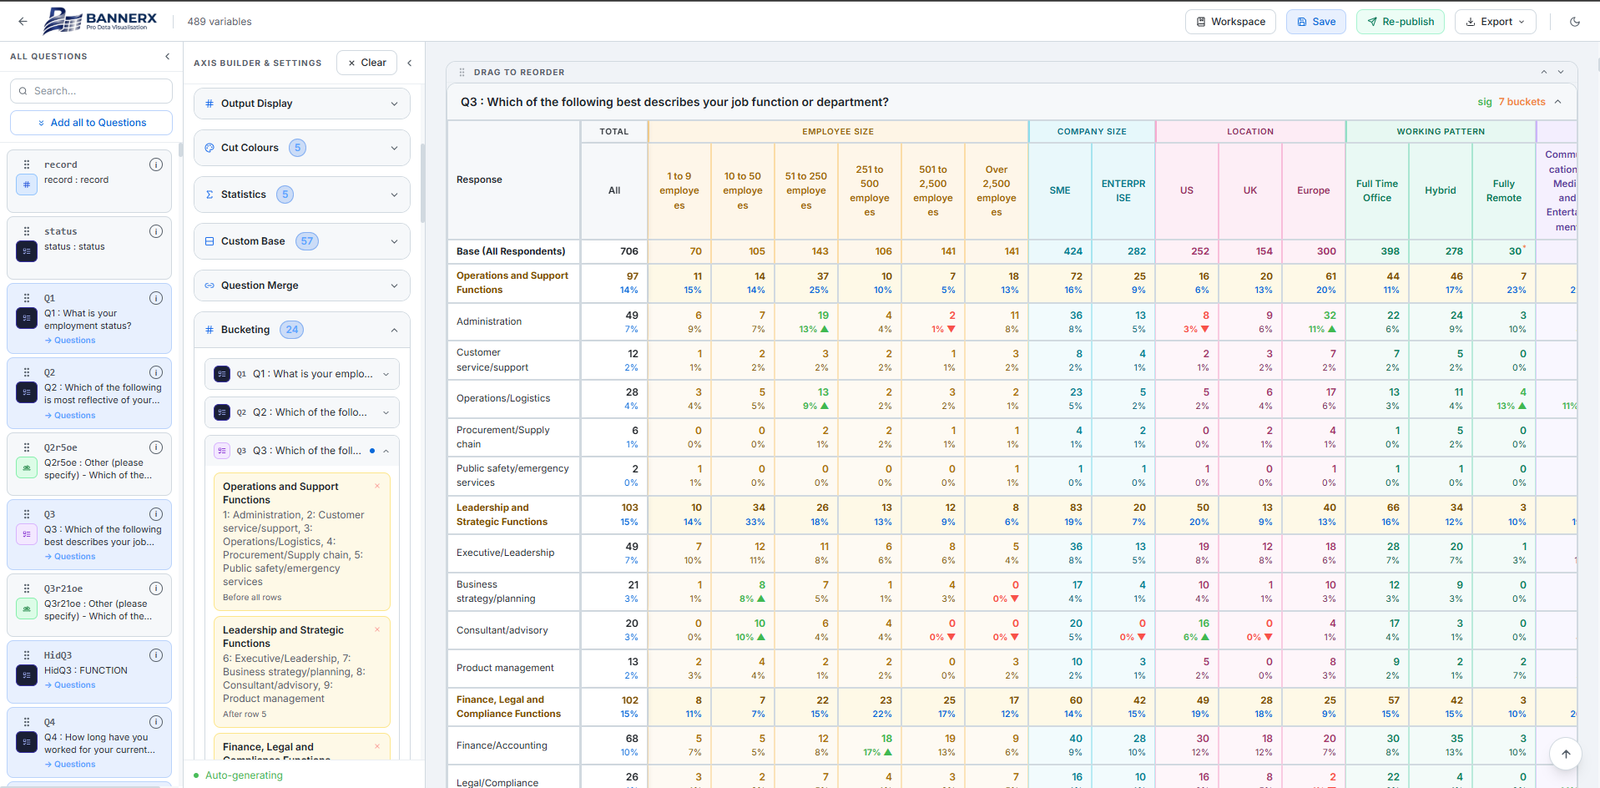
Assign colours to cuts for instant visual clarity in-platform and in export.
Switch between Counts, Percentages, or Both on the fly, no regeneration needed.
Auto Z-test at 95% vs Total, with ▲/▼ indicators and small-base flags (* / **).
Choose 0, 1, or 2 decimal places, toggled instantly. Rename cuts on the fly without touching source data.
Build your Y-axis and X-axis cuts visually. No coding required.
Advanced operations made simple. Calculate means, group questions, and filter populations instantly.
Define bespoke respondent populations per question. Build Top 2 Box, Bottom 2 Box, or custom bands in seconds.
Configure midpoint values or link to numeric questions. Aggregate response codes into custom summary rows.
Load one file with multiple waves. Split every cut column into wave sub-columns in one click.
Colour-coded cut headers, frozen panes, significance indicators, and structured totals — ready to send.
Clients log in to their own branded space; they see only what they're supposed to see.
Save your full banner setup (axes, groups, bases, order) and reload it instantly.
Send the completed banner to your client portal in all three display modes simultaneously.
Manage workspaces, reorder tables, and export beautiful deliverables.